Dynamic Reporting — AI-Driven Explainable Analytics
Smart dashboards, instant insights, and human-readable explanations — without writing code.
Overview
Dynamic Reporting helps teams transform raw data into dashboards and actionable explanations. Upload files, connect databases, ask questions in plain English — and click any chart point to understand why numbers changed. Built for non-technical users, it is fast, lightweight, and explainable by default.
Key Objectives
No-Code Analytics
Build dashboards from SQL, NoSQL, or CSV — without queries.
Explainable Insights
Show human-readable reasons behind spikes and drops.
Faster Decisions
Help teams understand trends instead of guessing.
Unified Data
Work with multiple formats in one simple platform.
Lightweight & Accessible
Quick setup and clean UI across all devices.
Future AI Power
Built for forecasting, anomaly detection, and voice assistance.
Core Features
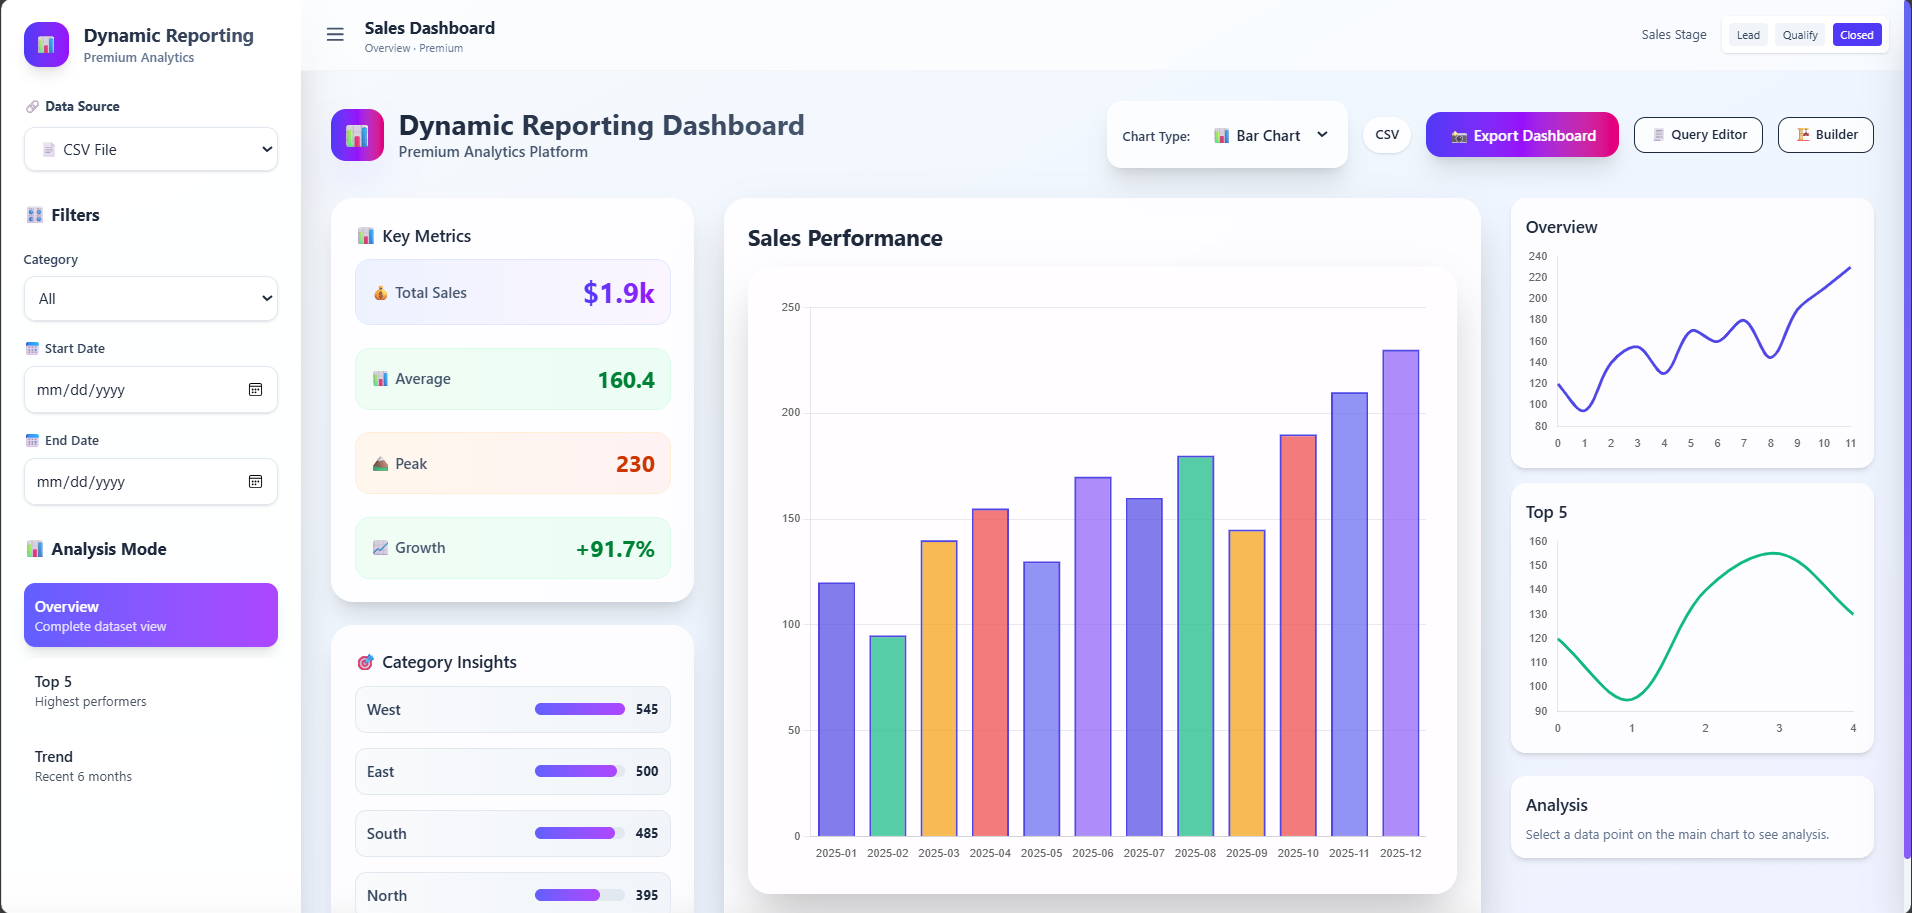
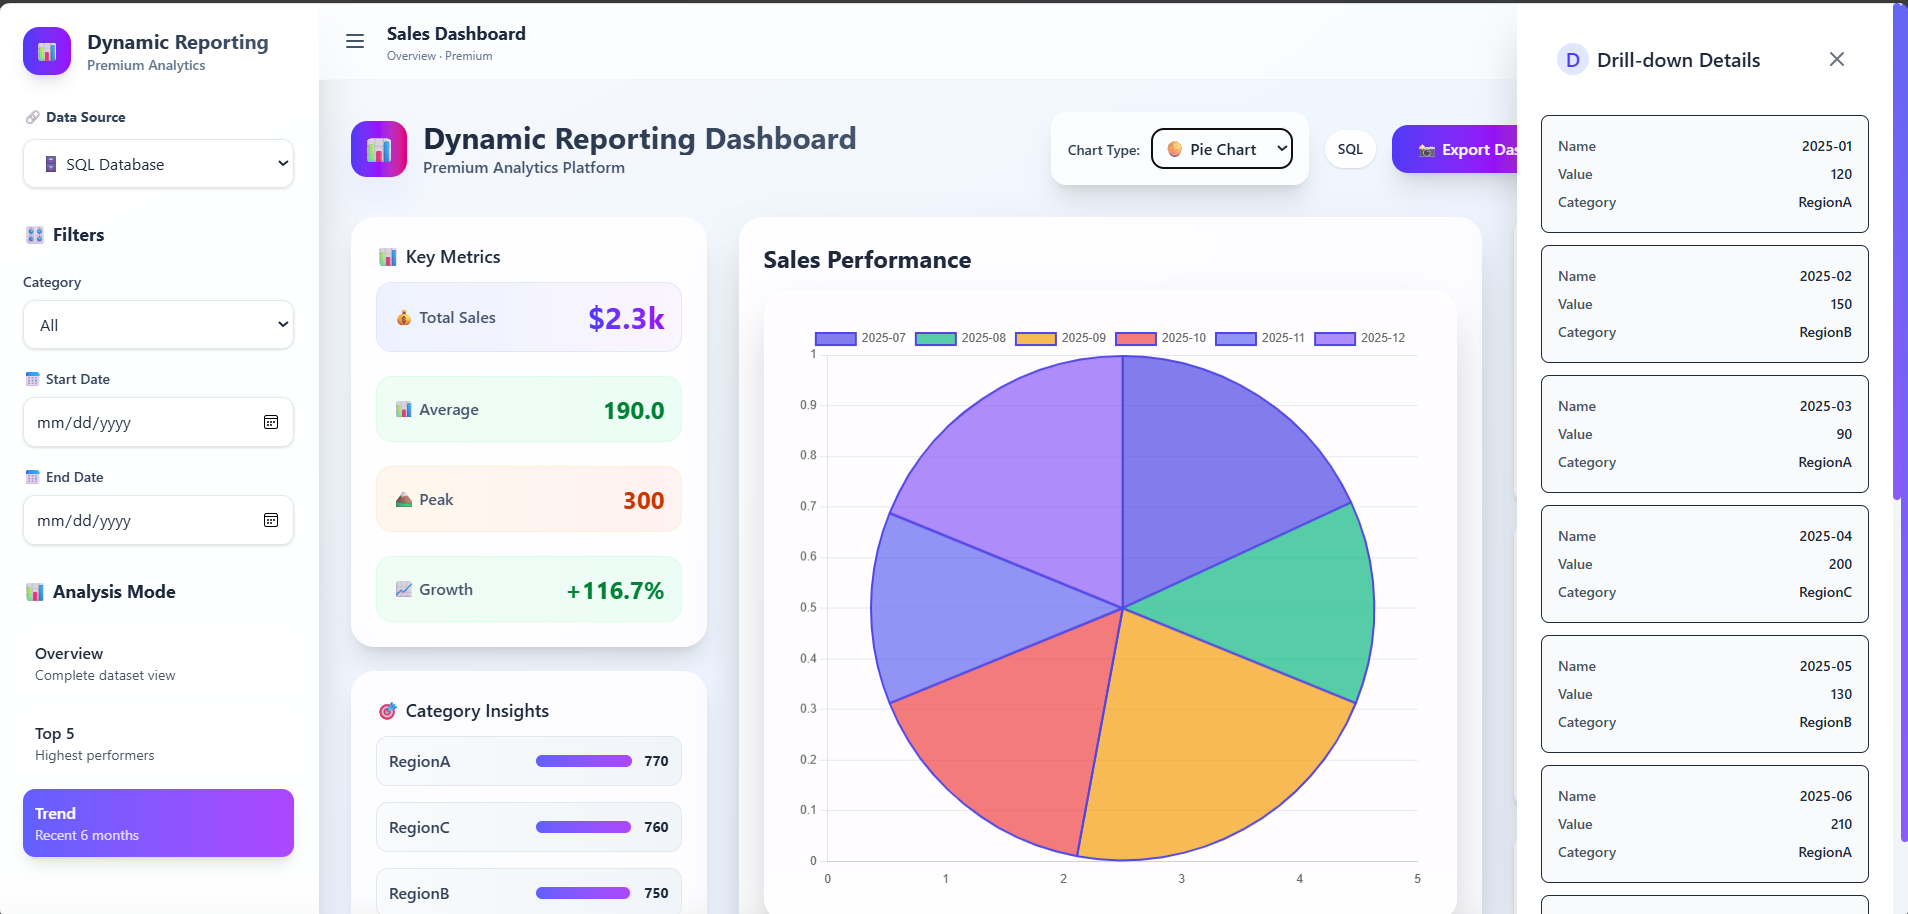
Interactive Dashboards
Drag-and-drop charts with live refresh and saved layouts.
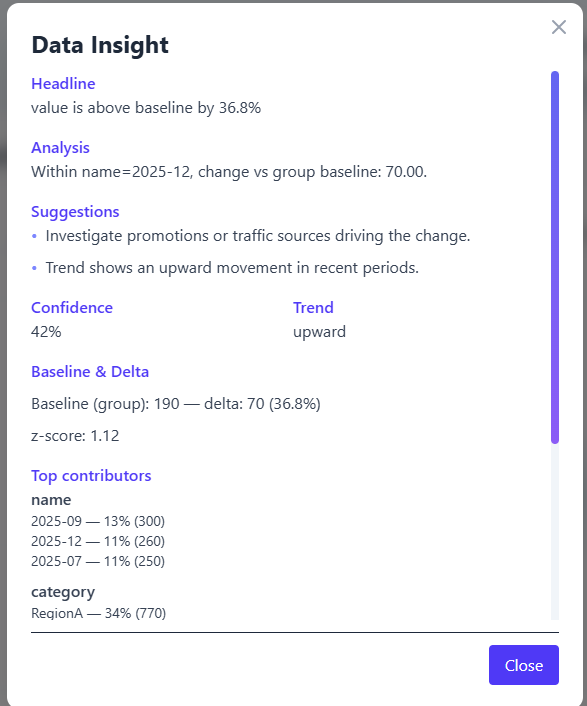
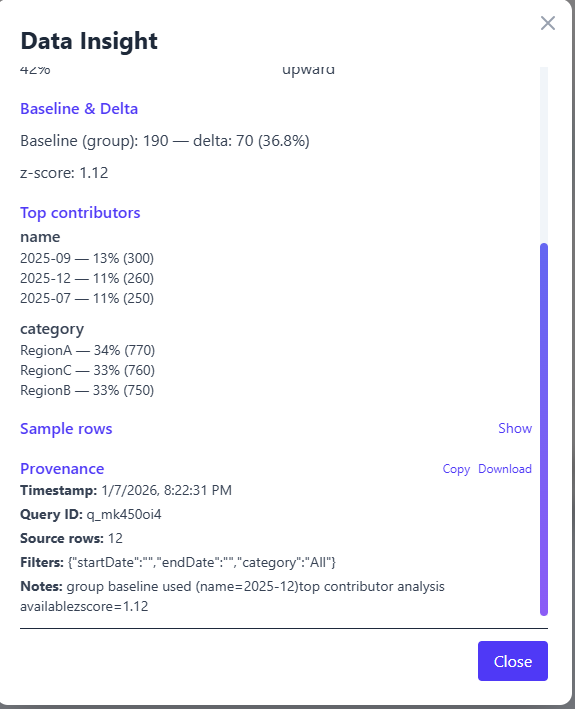
Click-to-Explain
Click any point to see why values changed — with confidence score.
Ask-Your-Data Chat
Ask questions in plain English and get charts automatically.
Anomaly Pulse
Detects unusual spikes or drops and alerts the user.
Unified Connectors
CSV uploads, MySQL, MongoDB — Google Sheets coming soon.
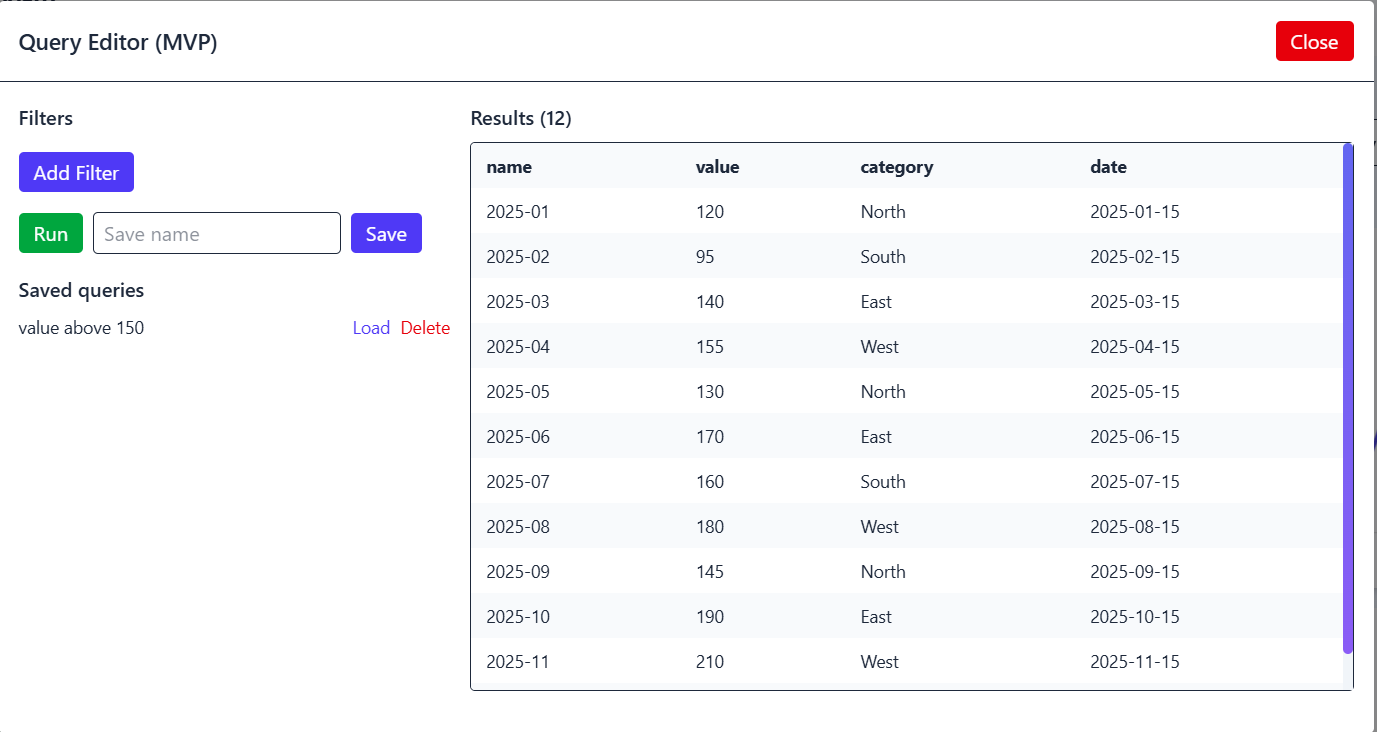
Query Editor
Create filters, run analytics, and save custom views.
Narrative Reports
Convert dashboards into automatic AI-written summaries.
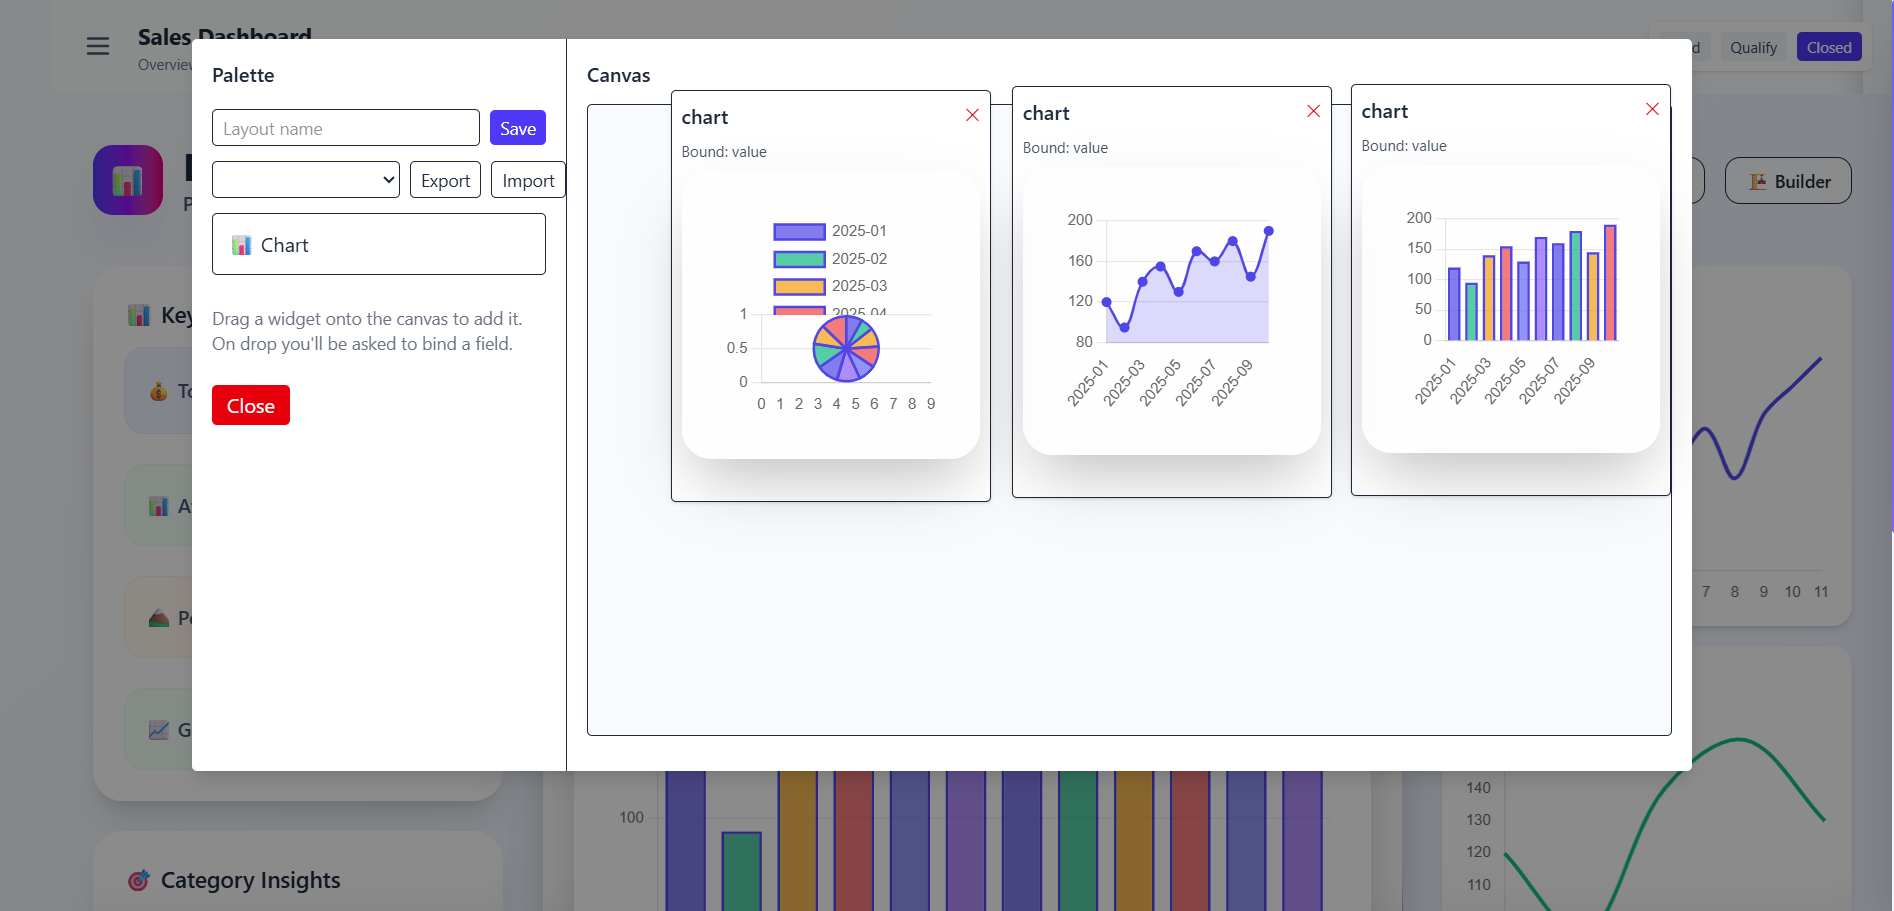
Builder
Compare diverse of data in visual format. and present our data like dashboard.
Planned AI Features
Forecasting
Predict trends automatically.
Voice Assistant
Ask questions by speaking — get insights instantly.
Auto Layouts
Generate dashboards automatically from data.
Tech Stack
Output Screenshots